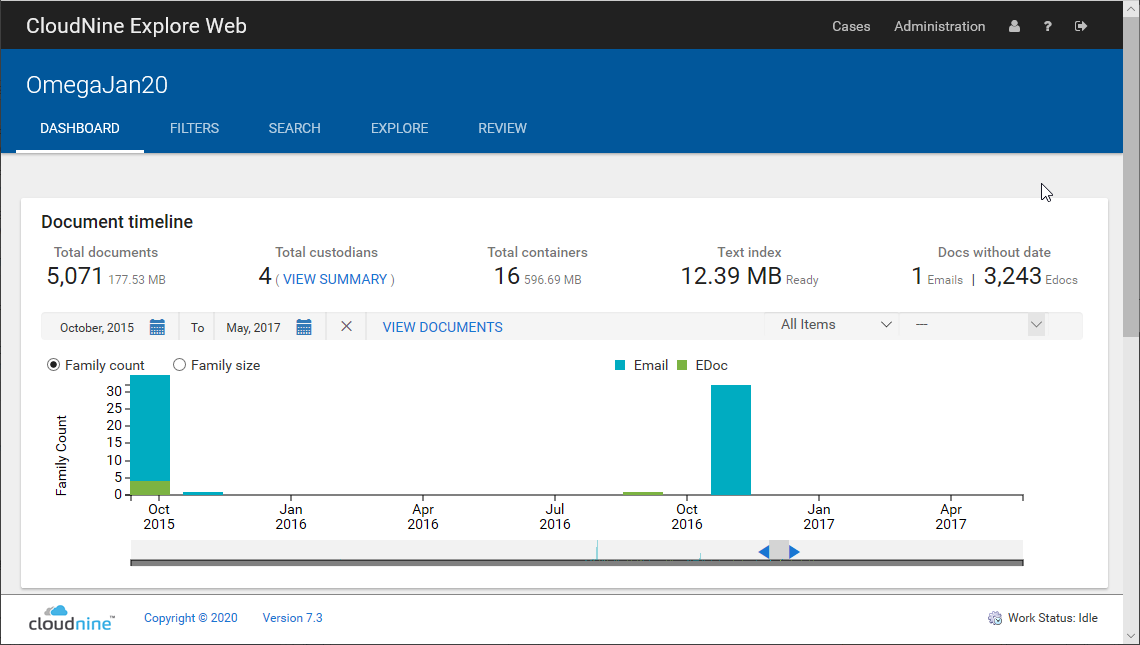
The top of the DASHBOARD page displays a Document timeline. In the Document timeline, you can see trends in the number and volume of electronic documents and email over time. The date range is represented in monthly increments. Documents in the timeline are color coded: emails are blue, and edocs (all non-email documents) are green.
|
Mail store files (e.g., .pst,.nsf), archive files (e.g., .zip), and forensic images (e.g., .E01, DD/RAW) files are not included in the Document timeline results. |

Adjusting the Document Timeline Display
There are three methods to modify the display of the Document timeline:
1.Select Date Range to Display on the Calendar
i.Click on the Calendar icon next to the start or end month displayed above the timeline graph. In the displayed calendar, select the month and year you want. Then click any day in the month to close the calendar and display the updated range of data on the Document timeline. Only month and year values (not day) are used to generate data for the Document timeline.
2.Adjust the Slider to Magnify Display Within the Date Range
i.You can click and drag the arrow on the left and/or right end of the slider bar below the Document timeline to adjust the zoom. You can also click and drag the gray bar between the arrows to adjust the section of the timeline that you want to magnify.
3.Click and Drag Using the Mouse to Magnify Display Within the Date Range
i.Click and drag your mouse over an area displayed on the Document timeline to set the area you want to magnify.
View Document Details
Click the VIEW DOCUMENTS link to open the EXPLORE page populated with the data from the current date range displayed in the Document timeline. If a custodian or import session is selected, they will also be automatically selected on the EXPLORE page.
View Details for a Specific Month
Hover over the bar for a month and CloudNine™ Explore Web provides:
•Number of Email documents in the month
•Number of Edocs in the month
•A VIEW DOCUMENTS link that takes you to the EXPLORE page to view the documents associated with the timeline month.
View Custodians
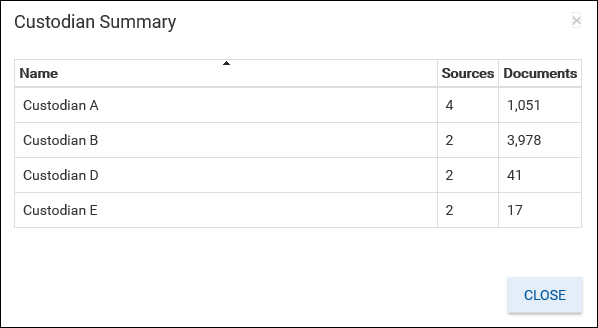
Click the VIEW SUMMARY link in the Total custodians section at the top to see the Custodian Summary dialog. The dialog lists the custodians associated with the document set along with source and document counts for each.

Update Timeline Graph by Custodian or Import Session
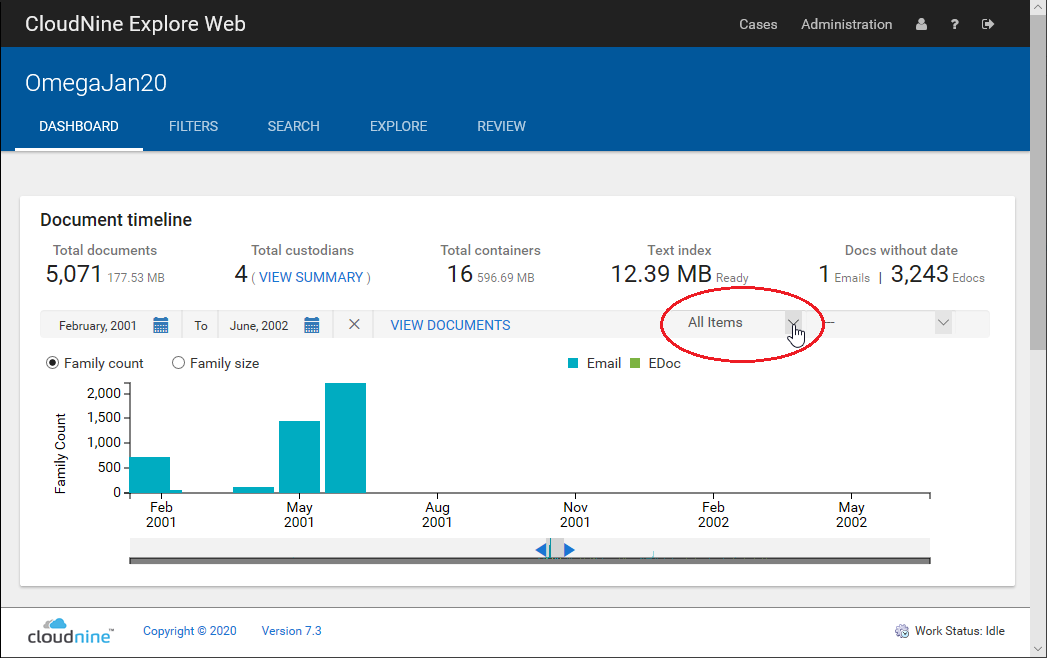
The Document timeline by default will display all documents for the date range chosen, regardless of custodian or import session. To the right of the VIEW DOCUMENTS link is a drop down. Select Custodian in the drop down to display a list of custodians in the right-most drop down. Select Import Session in the drop down to display a list of import sessions in the right-most drop down. You can then select the specific custodian or import set that you want to display in the timeline graph.
|
Modifying the date range, or selecting a specific custodian or import session only impacts the data shown in the graph. The totals displayed at the top of the Document timeline pane always reflect all data in the case. |
|
You may notice a difference between the document counts displayed in the Document timeline and the document counts displayed on the EXPLORE page. The Document timeline calculates document counts using all case documents, and is not restricted to documents remaining after filters are applied. In addition, documents in a case have multiple dates from the family it belongs to, a lower date and an upper date. To ensure that documents only show up once in the Document timeline, only one date is used for the family—the DateFilterUpperBound field. The EXPLORE page calculates documents using only the documents remaining after filters have been applied to the case. For date calculations, it uses the date range from both the DateFilterUpperBound field and DateFilterLowerBound field to determine the overlap of a document's date range with the date range used to filter. |
