The Case Dashboard provides a summary of case metrics and other information for the case currently opened in CloudNine™ Explore Web. Case information is available for the review team on the DASHBOARD tab for a case.
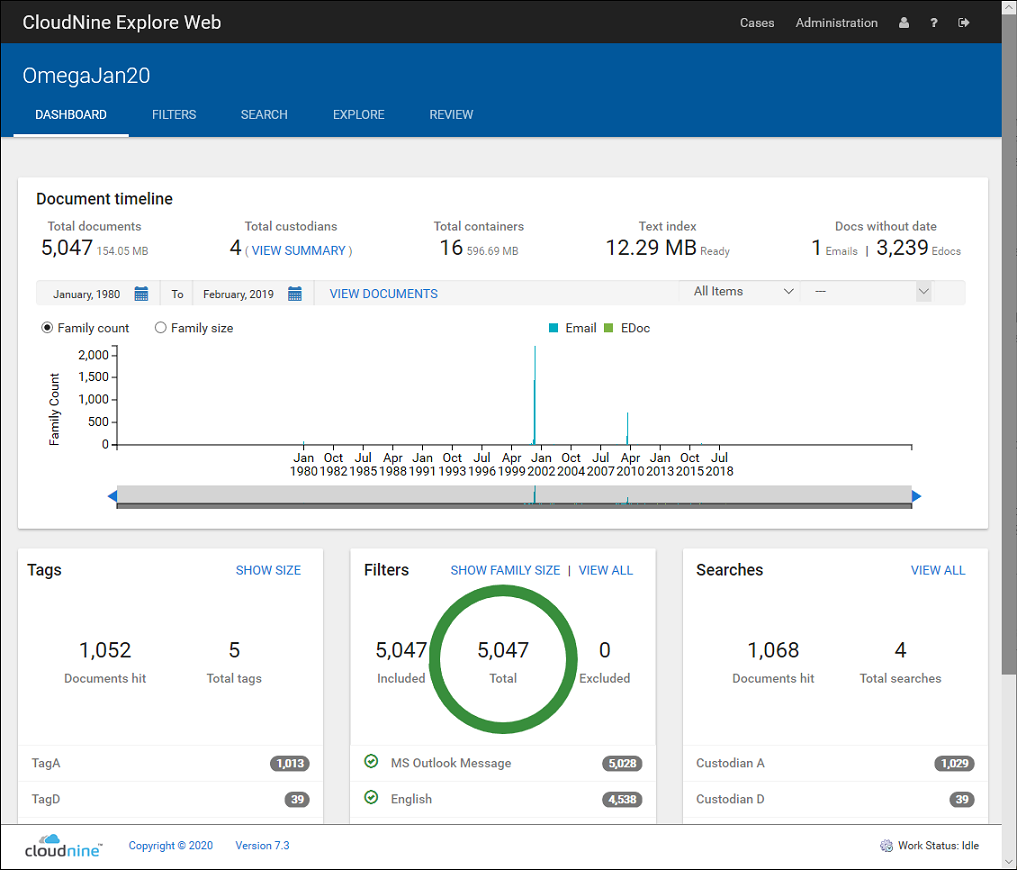
The dashboard is organized into 4 main sections: Document timeline, Tags, Filters, and Searches, which are described in more detail in the following sections. For all dashboard data displays, any Family Count or Family Size values are calculated based on parent size plus attachment size, not including containers.
Dashboard area |
Information available |
|---|---|
Document timeline |
Total number of documents Total size of all documents Number of custodians Link to a list of custodians, and the number of sources and documents for each Number of containers Total size of containers Size and state of readiness of the case index Number and total size of all documents without date information Graph displaying Family count or Family size for Email and EDoc content by date |
Tags |
Total number of tagged documents, expressed as Documents hit Number of tags in the case Total size of tagged documents A list of tags in the case and the number of documents or size of documents associated with each tag |
Filters |
Count or size of filtered documents List of filters with links to display on the FILTERS page |
Searches |
The number of documents included in a search The number of searches run List of searches with a link to display on the SEARCH page |