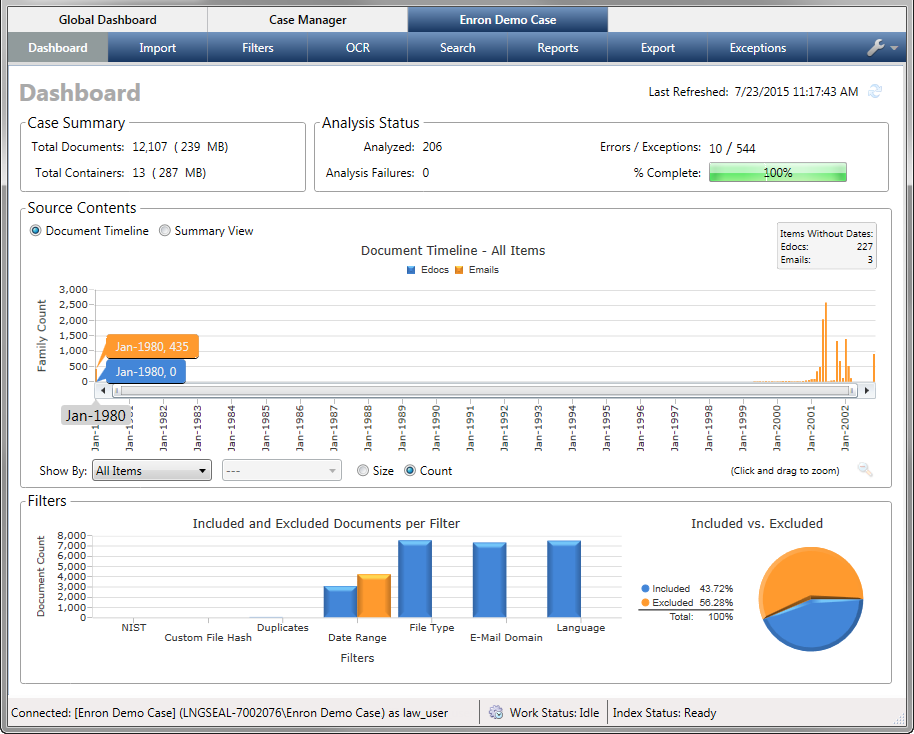
Within a top-level case tab in CloudNine™ Explore, you can access the Case Dashboard by selecting the Dashboard sub-tab. The Case Dashboard provides a summary of case metrics and other information for the selected case.
There are 4 main areas in the Case Dashboard.
•Case Summary - Located at the upper left of the Dashboard. It provides the following information:
oTotal Documents - The total number of all documents in a case (excluding container items) with the total family size of these documents in parenthesis.
oTotal Containers - The total number of container files (such as mail store .pst, .nsf files, archive .zip files) in the case.
•Analysis Status - Located at the upper right of the Dashboard. It provides the following information:
oAnalyzed - The number of files analyzed.
oAnalysis Failures - The number of failed analysis operations on individual files.
oErrors/Exceptions - The number of processing errors that occurred.
o% Complete - The current status of processing in terms of completed documents.
•Source Contents - Located in the center of the Dashboard. This section provides a document timeline for the case, and a bar chart representing the number of each file type in all committed sources. The Source Contents section defaults to the Document Timeline view (radio button at upper left of Source Contents). More information about the Document Timeline and Summary View is detailed below.
•Filters - Located in the bottom section of the Dashboard. The Filters area provides a bar chart representing the number of items for each filter type. This area also provides a pie chart comparing the percent of items included after filtering versus items remaining/excluded. You can place your cursor over the blue included sections or orange excluded sections of the bar chart to view the number of files included or excluded for a specific filter. Putting your cursor over the blue or orange sections of the pie chart shows the total number of files included or excluded.
Source Contents Document Timeline
The Document Timeline view provides a histogram of the documents imported into the case over time, which helps identify gaps in the case's files and shows trends in the case's data volume. By default, the date range is displayed in monthly increments. If the date range is greater than 10 years, the chart will default to yearly increments.
Blue bars represent electronic documents, and the orange bars represent email messages. The Show By drop-down allows you to view the histogram for All Items, a specific Custodian, or an Import Session. The Size and Count options allow you to determine whether the bars in the histogram represent the document family sizes in megabytes (MB) or the document family counts. The Items Without Dates displayed at the top right lists the total document count or size of the electronic documents and email messages in the case that do not contain dates, and are not included in the document timeline results.
|
Mail store files such as .pst and .nsf files, archive files such as .zip files, and forensic images such as .E01 or DD/RAW files, are not included in the Document Timeline results. |
•To view the Document Timeline for all case files, make sure All Items is selected in the Show By drop-down (Show By defaults to All Items).
•To view the Document Timeline for a specific custodian, select Custodian in the Show By drop-down. Then select the custodian of your choice in the drop-down to the right of Show By. You can only view the Document Timeline for one custodian at a time.
•To view the Document Timeline for a specific import session, select Import Session in the Show By drop-down. You can only view the Document Timeline for one import session at a time.
•To view the Document Timeline by document family count, select the Count radio option. Count is selected by default. When Count is selected, the graph displays the Document Timeline by document family count, and the Items Without Dates box displays the E-Docs and Emails values by total document count.
•To view the Document Timeline by document family size, select the Size radio option. When Size is selected, the graph displays the Document Timeline by document family size, and the Items Without Dates box displays the E-Docs and Emails values by total document size. Both the document family sizes and the total document sizes are displayed in megabytes (MB).
•To magnify a specific section of the Document Timeline, click and drag your mouse over the area you want to magnify. When you release your mouse button, the highlighted area is magnified.
•The slider at the bottom of the graph can be used to navigate through the dates represented in the graph, as well as change the zoom level of the graph. Click the gray box in the slider, and drag the slider left for older dates or right for more recent dates. To change the zoom level using the slider, click and drag the left or right side of the slider to the left or right, depending on which side of the graph you want to magnify and the zoom level you want to view. The zoom level is maximized by default.
•To reset the graph back to its default zoom level, click Reset Zoom (magnifying glass) in the lower-right corner of the Source Contents.
•To view the Size or Count value for a specific bar in the graph, place your mouse pointer over that bar.
|
When All Items is selected from the Show By list, the Items Without Dates box displays the total document count or size of the electronic documents and email messages in the case that do not contain date metadata, and are not included in the Document Timeline results. If Custodian or Import Session is selected from the Show By list, the Items Without Dates section only shows the values for the selected custodian or import session, not the entire case. Also the Size or Count value displayed for a specific bar in the graph is only for the selected Custodian or Import Session. |
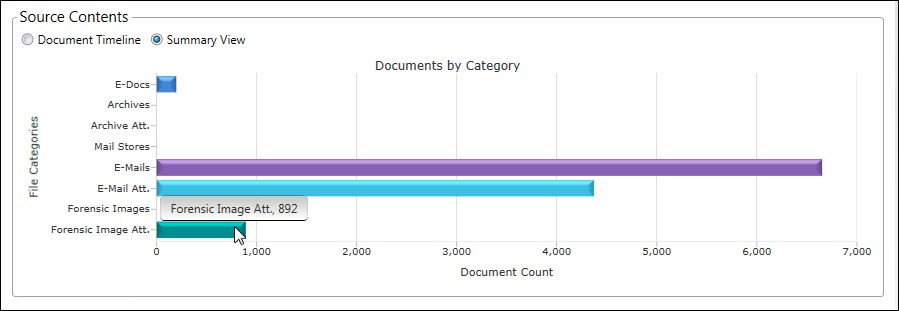
Source Contents Summary View
The Summary View bar chart displays the number of files imported into the case by file type category. Each file type category is represented by a unique color on the bar chart. Place your mouse over a bar in the chart to view the specific document count for the file type category.
Refresh the Case Dashboard
The Case Dashboard page is automatically refreshed each time you open the page. The date and time the page was last refreshed is displayed in the Last Refreshed field in the upper right.
If you are viewing a case's information on the Dashboard, and changes are made to the case while you are viewing the Dashboard, you can update the Dashboard with the latest case information by manually refreshing. To refresh, click the refresh button to the right of the Last Refreshed date.