The overall status of FYI Server can be monitored from the Server tab in the FYI Admin Console. You can also stop and start the servers and set server options from the Server tab.
The Server tab allows you to instantly view the following:
•Current CPU load percentage
•Amount of memory being used
•Number of users currently logged on to the server
•Amount of server traffic (received and transmitted in bites per second)
•Amount of disk memory being used by processes
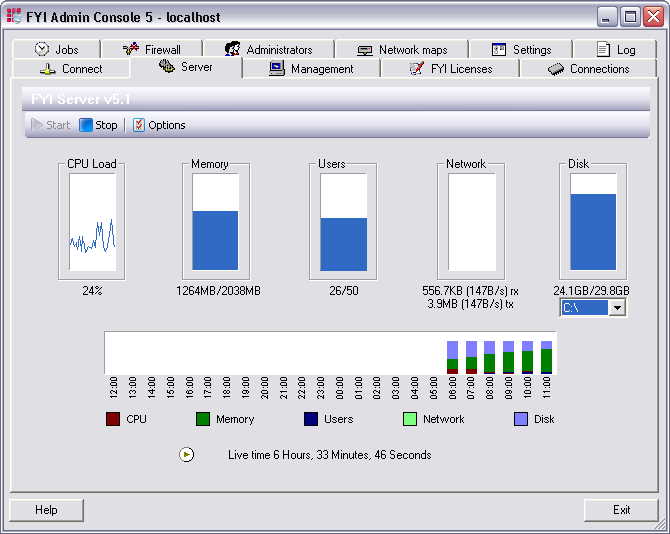
Each bar graph displays color indicating how resources are currently being used. Green in a bar graph indicates resources used by the FYI Server. Blue in a bar graph indicates overall resources used by the operating system. The lower portion of the Server tab displays the usage for the past 24 hours, with the latest information on the far right.
|
Click on a bar graph to change it to a line graph and toggle to change the graph views. |