The Global Dashboard is used to administer case processing in the following ways:
•Reviewing the list of all cases currently being processed.
•Monitoring the status of individual cases. The status includes the number of agents and processes currently running or pending for a case.
•Re-prioritizing the order of case processing.
•Suspending cases, and lifting cases from suspension.
•Monitoring the system-level status.
•Working with blacklisted cases.
•Controlling the refresh rate for information and statistics on the dashboard.
•Assigning processes to specific service machines.
•Removing offline machines from the Services tab list.
Monitoring Case Processing Status
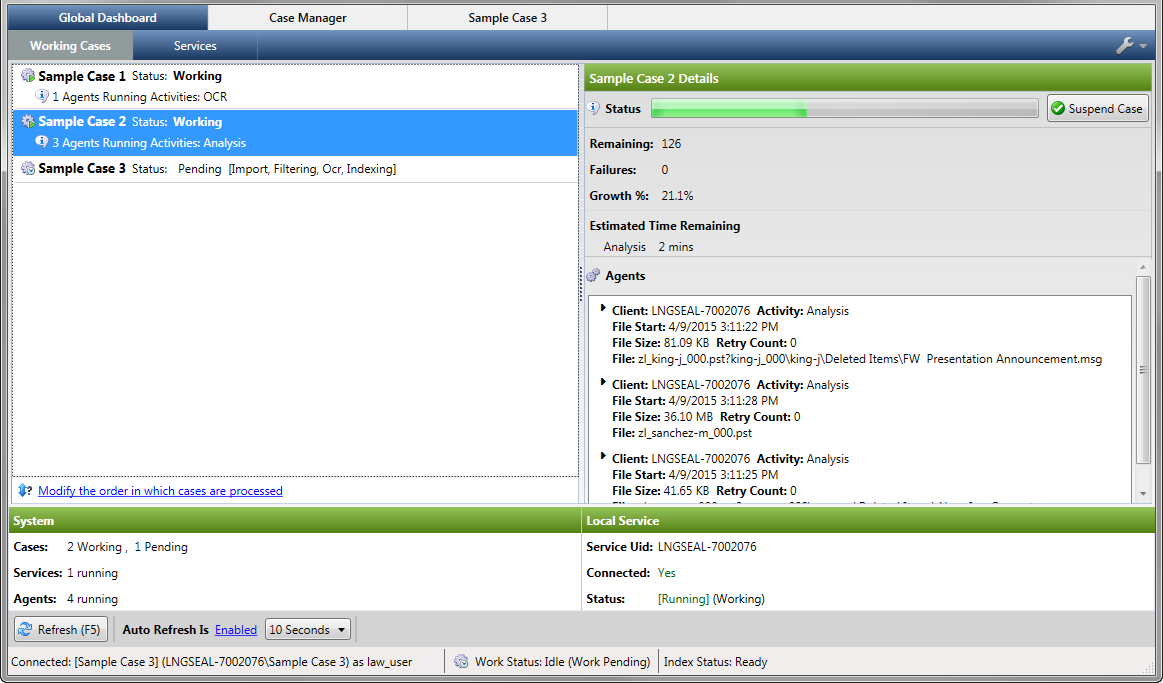
1.From the Global Dashboard tab, the Working Cases tab lists the cases with running processes.
2.Select a case. The processing details for that case are displayed.
|
If no case is listed, then no processes are running for any cases. |
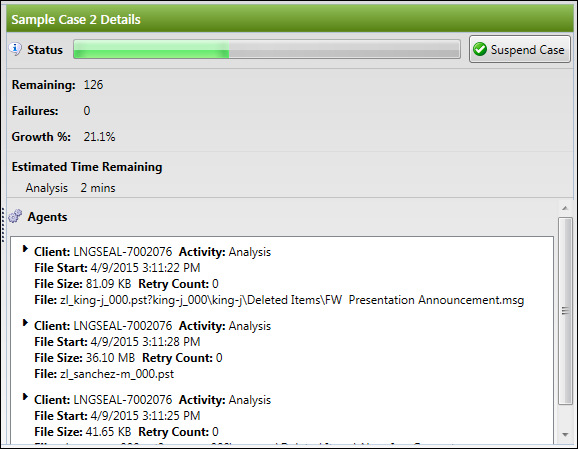
Case Details:
•Status bar. The relative processing progress.
•Remaining. The number of documents awaiting processing.
•Failures. The number of documents that were unable to be processed.
•Growth %. The percentage increase in disk space as a result of opening archives and attachments.
•Estimated Time Remaining. The estimated amount of time it will take to finish the current process for the selected case. While the Estimated Time Remaining is being calculated, <calculating> will be displayed. The Estimated Time Remaining field is currently only displayed for the following processes: Analysis, OCR, and Exporting.
•Agents. Each Client is named after the machine that is processing the source. The Activity is the phase of processing, e.g. analysis, inventory, etc. During the Analysis activity, the File Start, File Size, Retry Count, and File fields are also displayed for each agent currently running.
oFile Start. The date and time analysis began on the file displayed in the File field.
oFile Size. The size of the file currently being analyzed.
oRetry Count. The number of attempts to analyze the file. CloudNine™ Explore will try to analyze the file up to five times before logging an error and moving on to the next file.
oFile. The name of the file currently being analyzed. If the file exists within a container file, such as a .pst file, the file name and path to the file within the container is displayed.
Re-prioritizing Case Processing
The Global Dashboard displays the list of cases that are processing or waiting to be processed. This list is organized from top to bottom in the order that cases will be processed. The case processing priority order can be modified on the Modify Case Priorities dialog box.
1.From the Global Dashboard tab, the Working Cases tab lists the cases with running processes.
2.From Working Cases, click the Modify the order in which cases are processed link. The Modify Case Priorities dialog displays. Only the cases with a status of Working or Pending are displayed. By default, the cases are prioritized by date and time created, from oldest to newest with the oldest being processed first.
3.To change the processing priority of a case, select that case from the case list, and click one of the following buttons:
•Top - Moves the case to the top of the priority list to be processed first.
•Move Up - Moves the case up one level in the priority list.
•Move Down - Moves the case down one level in the priority list.
•Bottom - Moves the case to the bottom of the priority list to be processed last.
4.Click the Save button to save your changes. The Modify Case Priorities dialog closes, and the Working Cases tab of the Global Dashboard is updated.
Suspending or Resuming a Case
Suspending a case prevents all agents from working on the case. After a case is suspended, it can be resumed.
1.From the Global Dashboard tab, the Working Cases tab lists the cases with running processes.
2.Select a case.
3.Do one of the following:
•To suspend the case from processing, click Suspend Case.
•To resume processing, click Lift Suspension.
Monitoring Overall Processing Status
On the Working Cases tab, the panel at the bottom of the window provides status indicators.
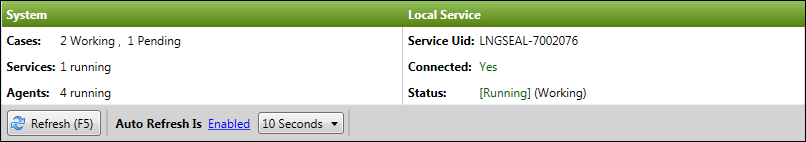
•System
oThe number of cases working and cases pending.
oTotal number of available CloudNine™ Explore services and the number of services running.
oNumber of agents running.
•Local Service
oService Uid
oConnection status
oRunning status
Refresh Rate of Dashboard Information
1.From the Global Dashboard tab, the Working Cases tab lists the cases with running processes.
2.At the bottom of the tab under the System section, do one of the following refresh options:
•Click the Refresh (F5) button to refresh the Working Cases tab.
•In the Auto Refresh Is field, click the Disabled link to enable auto-refresh feature, and then in the refresh frequency list, click the auto-refresh rate. The refresh frequency list defaults to 10 seconds.
•If the auto-refresh feature is already enabled, you can modify the auto refresh rate by clicking another rate in the refresh frequency list.
•In the Auto Refresh Is field, click the Enabled link to disable the auto-refresh feature.
Assigning Processes to Service Machines
In CloudNine™ Explore, you can help distribute the workload across different service machines from the Services tab on the Global Dashboard. For example, you can dedicate a specific service machine or machines to only searching or the OCR process. By default, all processes are automatically assigned to each CloudNine™ Explore service machine. The service machines are listed on the Services tab and the processes assigned to machine are listed in the Enabled Processes column.
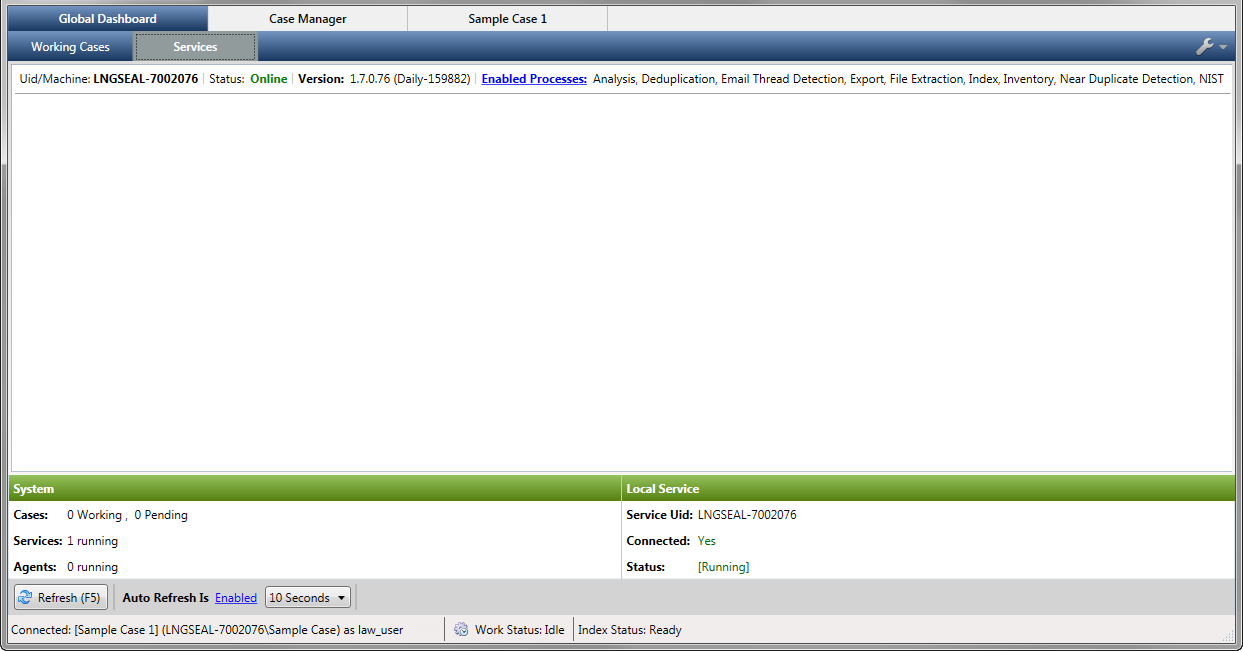
1.From the Global Dashboard tab, the Working Cases tab lists the cases with running processes.
2.Click the Services tab. The service machines being used for CloudNine™ Explore are listed. The Enabled Processes column displays the processes currently assigned to the service machine. By default all services are assigned to each service machine.
3.Click the Enabled Processes link for the service machine for which you want to modify process assignments. The Modify Service Client Processes dialog opens. By default, all the process check boxes are selected, therefore, all services are assigned to the service machine.
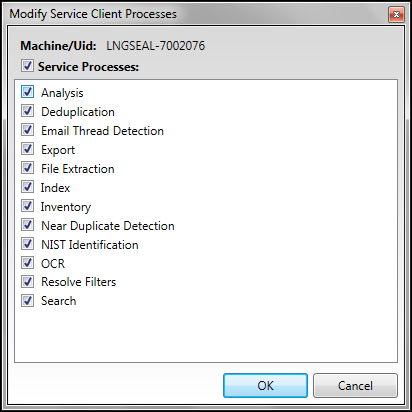
4.Clear the check boxes for the CloudNine™ Explore processes that you do not want to run on the service machine. You can remove all processes from the machine by clearing the Service Processes check-box at the top.
5.Click OK. The Modify Service Client Processes dialog closes and your changes are saved. The Enabled Processes column is updated.
|
Changes to the process assignments only apply to newly started agents, they do not apply to agents currently running. |
Removing Offline Machines
Offline machines can be removed from the machine list on the Services tab by clicking the Remove link in the Status column. When the Status field shows a machine as Offline, then the Remove link is displayed next to the Status field.
1.From the Global Dashboard tab, the Working Cases tab lists the cases with running processes.
2.Click the Services tab. The service machines being used for CloudNine™ Explore are listed.
3.For any offline machine you want to remove from the machine list on the Services tab, click the Remove link next to Offline in the Status field.
![]()
4.The offline machine is removed from the machine list.
|
If you remove an offline machine from the list, and the same machine comes back online, the machine will automatically be displayed in the machine list on the Services tab, and the Status field for the machine will be changed to Online. |